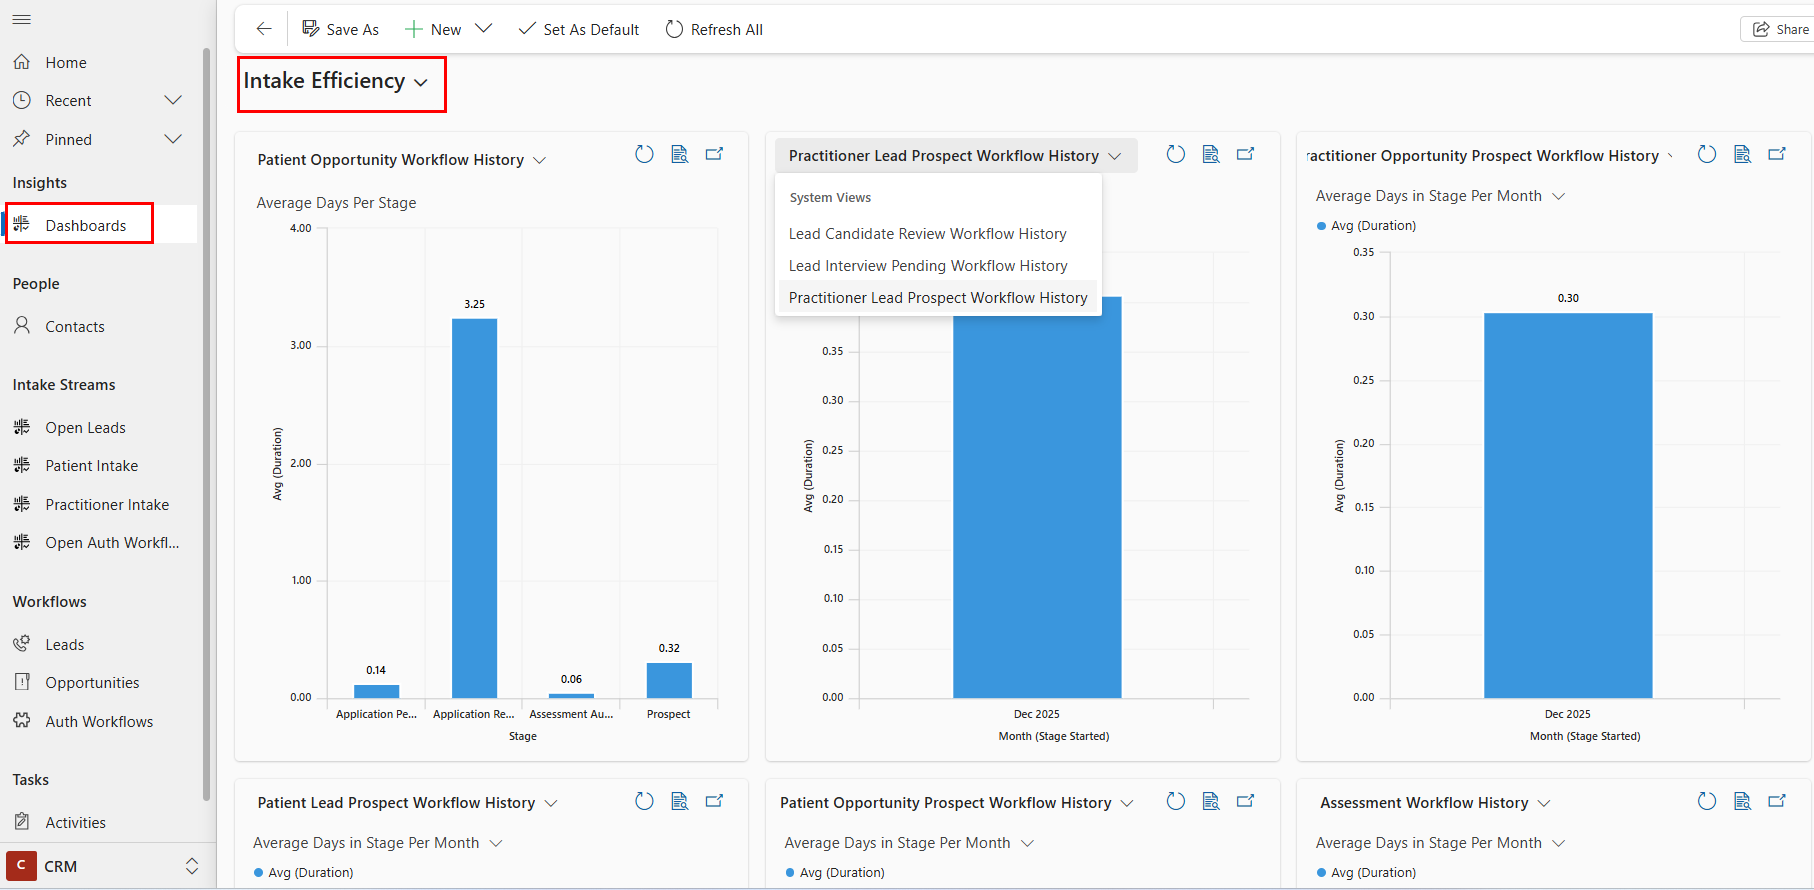
Intake Efficiency Dashboard
Go to 'Dashboards' on the site menu and select the Intake Efficiency Dashboard to review:
- Average Days Per Stage of Workflow for:
- Practitioner Leads
- Practitioner Opportunities
- Patient Leads
- Patient Opportunities
- Authorization Workflows
- Average Days Per Stage, month over month (based on when that stage was started) for each of the stages of:
- Practitioner Lead Workflows (Prospect, Interview Pending, Candidate Review)
- Practitioner Opportunity Workflows (Prospect, Candidate Review, Offer, Onboarding)
- Patient Lead Workflows (Prospect, Application Pending)
- Patient Opportunity Workflows (Prospect, Application Pending, Application Review, Authorization Pending (total time from Assessment Authorization to Completion of opportunity))
- Authorization Workflows (Assessment Authorization, Assessment, Assessment Review, Service Authorization)
- Average Days Per Stage Per Business Unit / Intake Specialist for each of the stages above