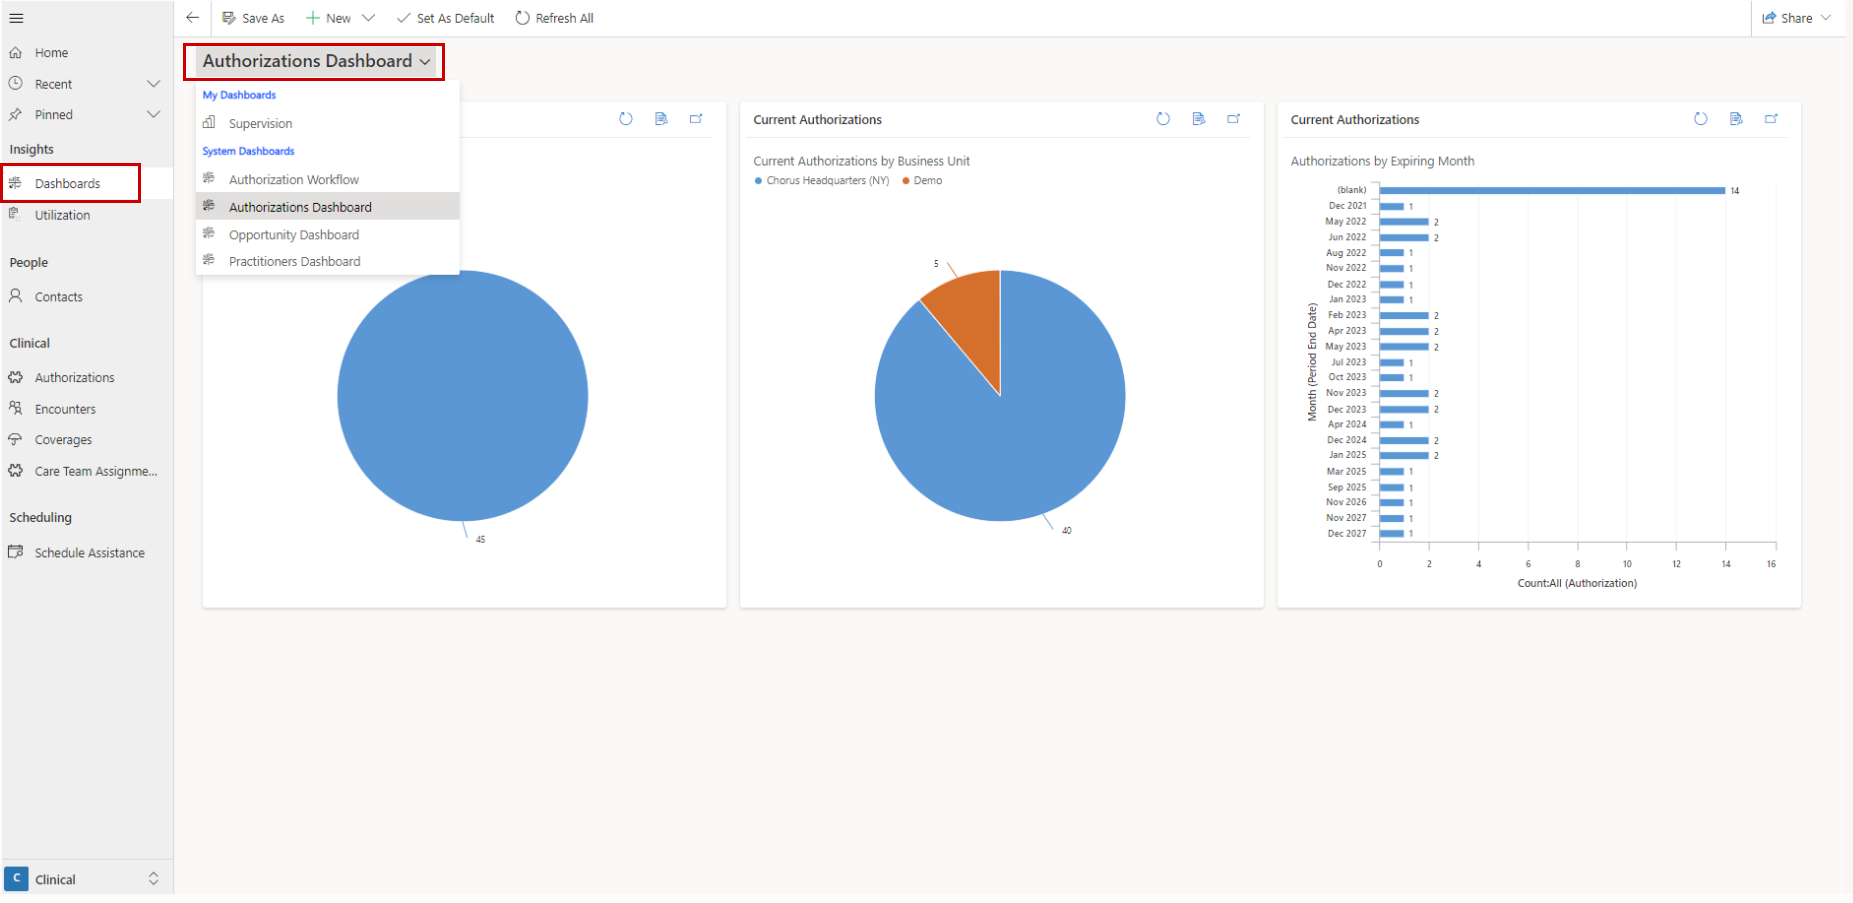
Dashboards
Dashboards are collections of easy-to-read visualizations and lists that put key metrics at your fingertips, so you can track progress, identify trends, and make informed decisions— helping your organization provide more effective care.
Dashboards can be created and personalized according to your needs.
Dashboards in the system include:
Opportunity Dashboard - View monthly progress based on opportunities opened per month per business unit or referral channel. Learn more about the opportunity dashboard.
Authorization Workflow - View authorization workflows at each stage, so you can efficiently work through assessments to assign, overdue assessments, assessments to review, authorizations to request, and more. Learn more about the authorization workflow dashboard.
Intake Efficiency - View the average days per stage of specific CRM workflows and measure improvement over time. Learn more about the Intake Efficiency dashboard.
Patient Documents Dashboard - View expired/expiring patient documents. Learn more about the Patient Documents dashboard.
Authorizations Dashboard - View count of authorizations per payer, business unit, or expiring month.
Qualifications Dashboard - View expired/expiring practitioner qualifications, qualifications per status reason, practitioners per qualification, and insurance plan benefit required qualifications. Learn more about the Qualifications dashboard.
Session Data
The Session Data Dashboard gives your clinical managers a bird's eye view of the clinical data being collected in your organization.
The Data Analysis report gives you visibility to data collection and treatment progress across your entire organization. Filter by practitioner, patient, skill acquisition domain/subdomain, or target status and review target graphs for the selected date range. Hover on a data point or a condition change line to review its details.
The BT Data Per Day report allows easy monitoring of practitioner performance. Filter by practitioner or patient to ensure the amount of data collection per day is meeting your organization's standards.
The Care Plans report is an organized view of each patient's complete care plan. Filter by practitioner, patient, skill acquisition domain/subdomain, or target status and review target configurations, instructions, intervention techniques, etc. for full visibility to your organization's care plans.
The Session Notes report is a clear view of all session notes in your organization. Filter by practitioner, patient, and procedure code to review session notes collected in the date range selected.
To reset all filters you applied to the report, simply refresh your browser.
Supervision Ratios
The Supervision Ratios Dashboard gives you an easy way to monitor how much supervision each practitioner and patient are receiving.
This report calculates the ratio of supervision (Direction of Technician services) to direct care services based on the filters you select.
- Filter by patient/practitioner to see how much supervision they received
- Filter by month
- Choose to include/exclude submitted sessions
- Filter by patients/practitioners with less than 5/10/20 % supervision ratios
- Filter by specific authorization to review
- Click the link icon on any row in the results table to open the Encounter Service in a new tab.
To reset all filters you applied to the report, simply refresh your browser.
Utilization
The Utilization Dashboard gives you a streamlined way to track the utilized and remaining hours for each authorization service, empowering your organization to create schedules that maximize utilization.
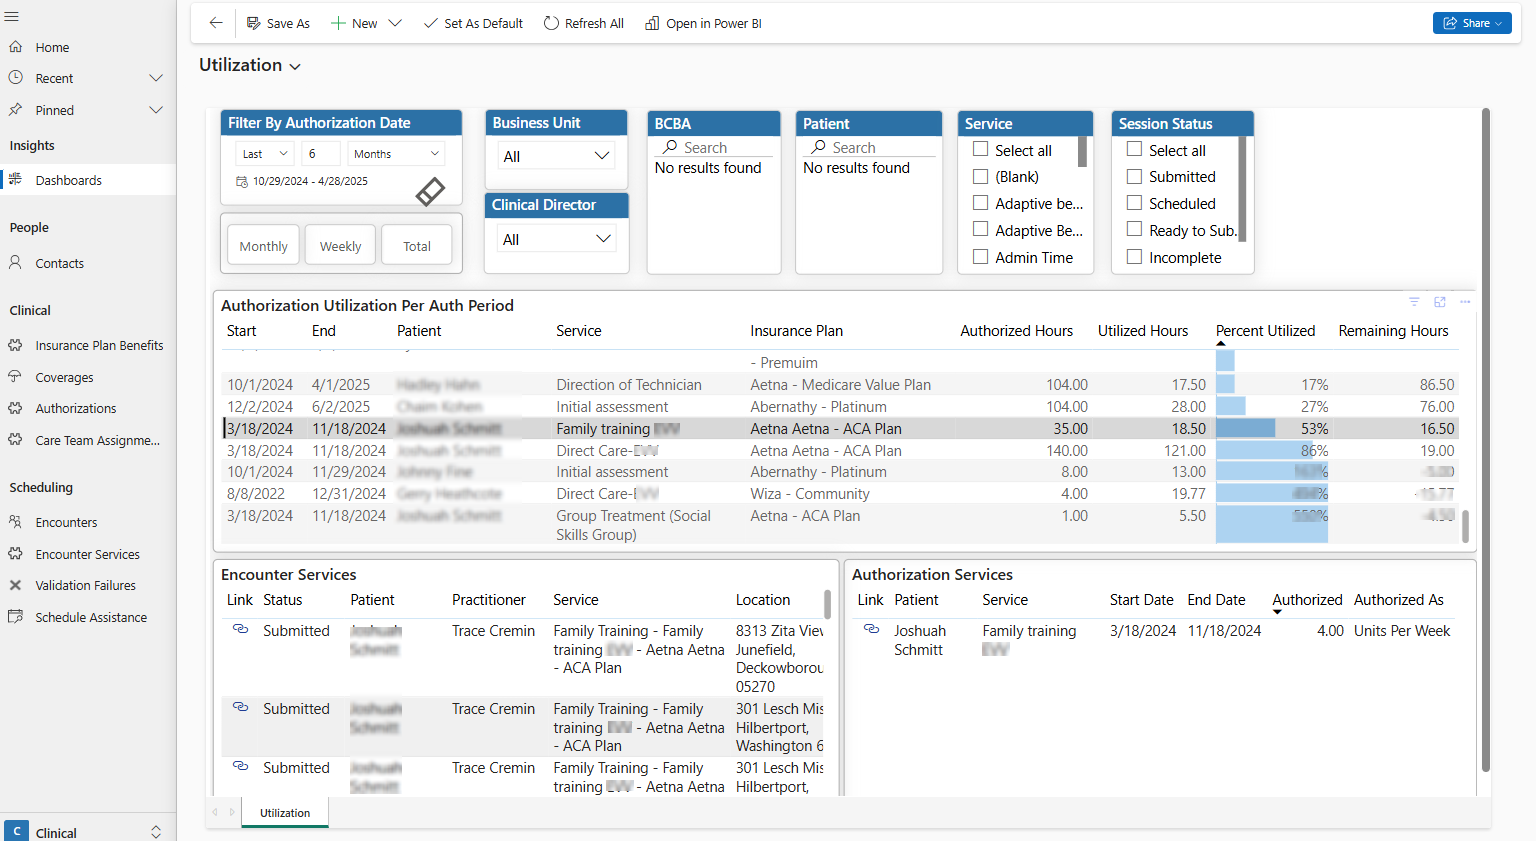
The report is divided into 3 tabs:
- Total (default): this tab displays the percent utilized for all authorization services, no matter how they are authorized. For example, a service authorized as 10 hours per week would still show on this tab, and the percent utilized will be based on the hours utilized out of 10 hours * the amount of weeks in the authorization period.
- Weekly: this tab gives you a focused view of utilization for every individual week, for authorization services authorized per week. This empowers you to flag weeks with low utilizations, and make scheduling adjustments as needed.
- Monthly: this tab gives you a focused view of utilization for every individual month, for authorization services authorized per month. This empowers you to flag months with low utilizations, and make scheduling adjustments as needed.
- Use the Business Unit filter when focusing on a specific department of your organization, or the service filter when reviewing utilization for a specific service.
- Use the authorization filter to narrow down your results to just current authorizations, or just future authorizations.
- When focusing on the utilization rates of upcoming schedules, or to include sessions that were not submitted yet, clear the session status filter so all future sessions are included.
- To reset all filters you applied to the report, simply refresh your browser.